Welcome to OpenReport Documentation
Overview
This is the homepage of OpenReport documentation. Here, you will find links to various sections of the documentation to guide you through the setup, usage, and advanced topics.
- Structure
- Components
- Components appearance
- Components generation
- Import python executables
- AI Content Generation
- Parameters
- Iterations
- Document iterations
Feel free to navigate through these sections to learn more about the project and its capabilities.
Installation
OpenReport Base is available on PyPI. Install it using pip:
pip install openreport-base
Or using Poetry:
poetry add openreport-base
Requirements: Python 3.12 or higher.
After installation, verify it works:
from OpenReport import OpenReportDocumentGenerator
OpenReport Base includes support for:
- Text and Headings
- Mathematical expressions
- Bullet lists
- Page breaks
- Document styling and parameters
- Table of contents
- PDF export
Recommended IDE Plugin
For enhanced YAML editing experience, we recommend installing the yamlconfig-idea plugin:
- Open PyCharm/IntelliJ IDEA
- Go to File → Settings (or PyCharm → Preferences on macOS)
- Navigate to Plugins in the left sidebar
- Click Marketplace tab
- Search for "yamlconfig-idea"
- Click Install next to the plugin
- Restart your IDE when prompted
This plugin provides enhanced YAML syntax highlighting, validation, and autocompletion features that improve the OpenReport YAML specification editing experience.
What OpenReport can do?
OpenReport is a powerful YAML-based tool for creating fully automated and parameterized documents. OpenReport streamlines the integration of user's own analysis and custom formatting into structured reports.
Features
- Parses a YAML specification file, which can be intuitively created using autocomplete.
- Supports essential document components including texts, headings, tables and figures:
- components can be generated dynamically based on the user's own analysis.
- components can be parameterized specifying text and heading styling, table formatting, and figure embedding.
- Supports user-defined parameters for enhanced flexibility.
- Supports loop for adding repetitively (a set of) similar components.
- Supports loop for document batch creation.
- Generates fully formatted Word or PDF documents from a YAML specification file.
The YAML file defines a structured sequence of actions, including generation and formatting rules, which OpenReport converts into ready-to-use document.
Functionality
OpenReport offers a structured and reusable approach to document creation. Using an intuitive YAML-based framework, it allows users to define the structure, formatting, and content of automated reports. From a YAML specification file, OpenReport generates a Word (.docx) or PDF document containing a well-organized set of parameterized elements, including:
- Text
- Headings
- Tables (with captions)
- Figures (with captions)
- Mathematical expressions
- Bullet lists
- External Word files
- Automatically generated:
- Table of contents
- List of figures
- List of tables
A valid YAML file must contain 'document', 'name', and 'structure' keys. For example:
document:
  name: document.docx
  structure:
    - heading:
        # heading attributes
    - text:
        # text attributes
    - table:
        # table attributes
    - figure:
        # figure attributes
Component formatting
Each component supports custom formatting. For example:
- text:
    body: Hello World!
    font: Calibri
    size: 9
To avoid repeating the same formatting on every component, OpenReport supports default styles at the document level. For example:
document:
  name: report.docx
  document_style:
    default_text_style:
      font: Calibri
      size: 11
The full formatting functionality is available at: Components.
Component generation
Components can be dynamically generated using the 'source' key. For example:
- figure:
    source:
      output: figure
      source_type: local
      location: 'inputs/figure.jpg'
The generation mode can be 'local' (for locally stored files) or 'python' (for output generated by python code). With python mode any kind of user's own analysis can be incorporated directly in the desired place of the document. For example:
- table:
    source:
      output: table
      source_type: python
      python_executable: generate_table
    table_font: Times New Roman
    table_font_size: 9
    caption:
      body: This is a table caption
The inputs for user-defined function can be specified directly under 'source'. For example:
- figure:
    source:
      output: figure
      source_type: python
      python_executable: plot_sales_per_year
      country_name: France
fig = plot_sales_per_year(country_name="France")
To use python executables, the "imports" property is specified at the document level and points to a Python file containing import statements of the user's functions:
from my_analysis import generate_table
from my_analysis import plot_sales_per_year
Text and heading components can also be generated using AI. The "ai_prompt" property sends a prompt to a configured AI provider and uses the response as the component's body content:
document:
  name: report.docx
  ai_config:
    provider: openai
    model: gpt-4o-mini
  structure:
    - text:
        ai_prompt: "Write a professional paragraph about renewable energy trends."
        font: Calibri
        size: 11
The full generation mode functionality is available at: Components generation.
Parameters
OpenReport allows to declare a parameter and assign it a value. For example:
- parameter:
    parameter_name: year
    parameter_type: manual
    parameter_value: 2025
- text:
    body: Happy New @parameter{year} Year!
    colour: #ffffff
Parameters can be defined using 'source' key. For example:
- parameter:
    parameter_name: total_sales
    parameter_type: source
    source:
      output: text
      source_type: python
      python_executable: calculate_total_sales
- text:
    body: Total sales for year @parameter{year} is @parameter{total_sales}.
Total sales for year 2025 is 250,000.
The full parameter functionality is available at: Parameters.
Iterations
OpenReport allows to declare a loop and add repetitively (a set of) similar objects using the @iterator{iterator_name} format. For example:
- loop:
    iterator_name: year
    iterator_type: manual
    iterator_values: [2025, 2026]
    iterator_applicable:
      - text:
          body: Total sales for year @iterator{year} have increased.
Total sales for year 2025 have increased.
Total sales for year 2026 have increased.
Loops can be defined using 'source' key. For example:
- text:
    body: "The sales per month are:"
- loop:
    iterator_name: sales_month_i
    iterator_type: source
    source:
      output: array
      source_type: python
      python_executable: calculate_sales_per_month
    iterator_applicable:
      - text:
          body: " - @iterator{sale_month_i} EUR"
The sales per month are:
 - 10 EUR
 - 20 EUR
 - 30 EUR
Document Iterations
OpenReport enables batch document creation: For example:
document_loop:
iterator_name: country
iterator_type: manual
iterator_values: [Germany, France]
iterator_applicable:
- document:
name: @iterator{country}_sales_report.docx
structure:
- heading:
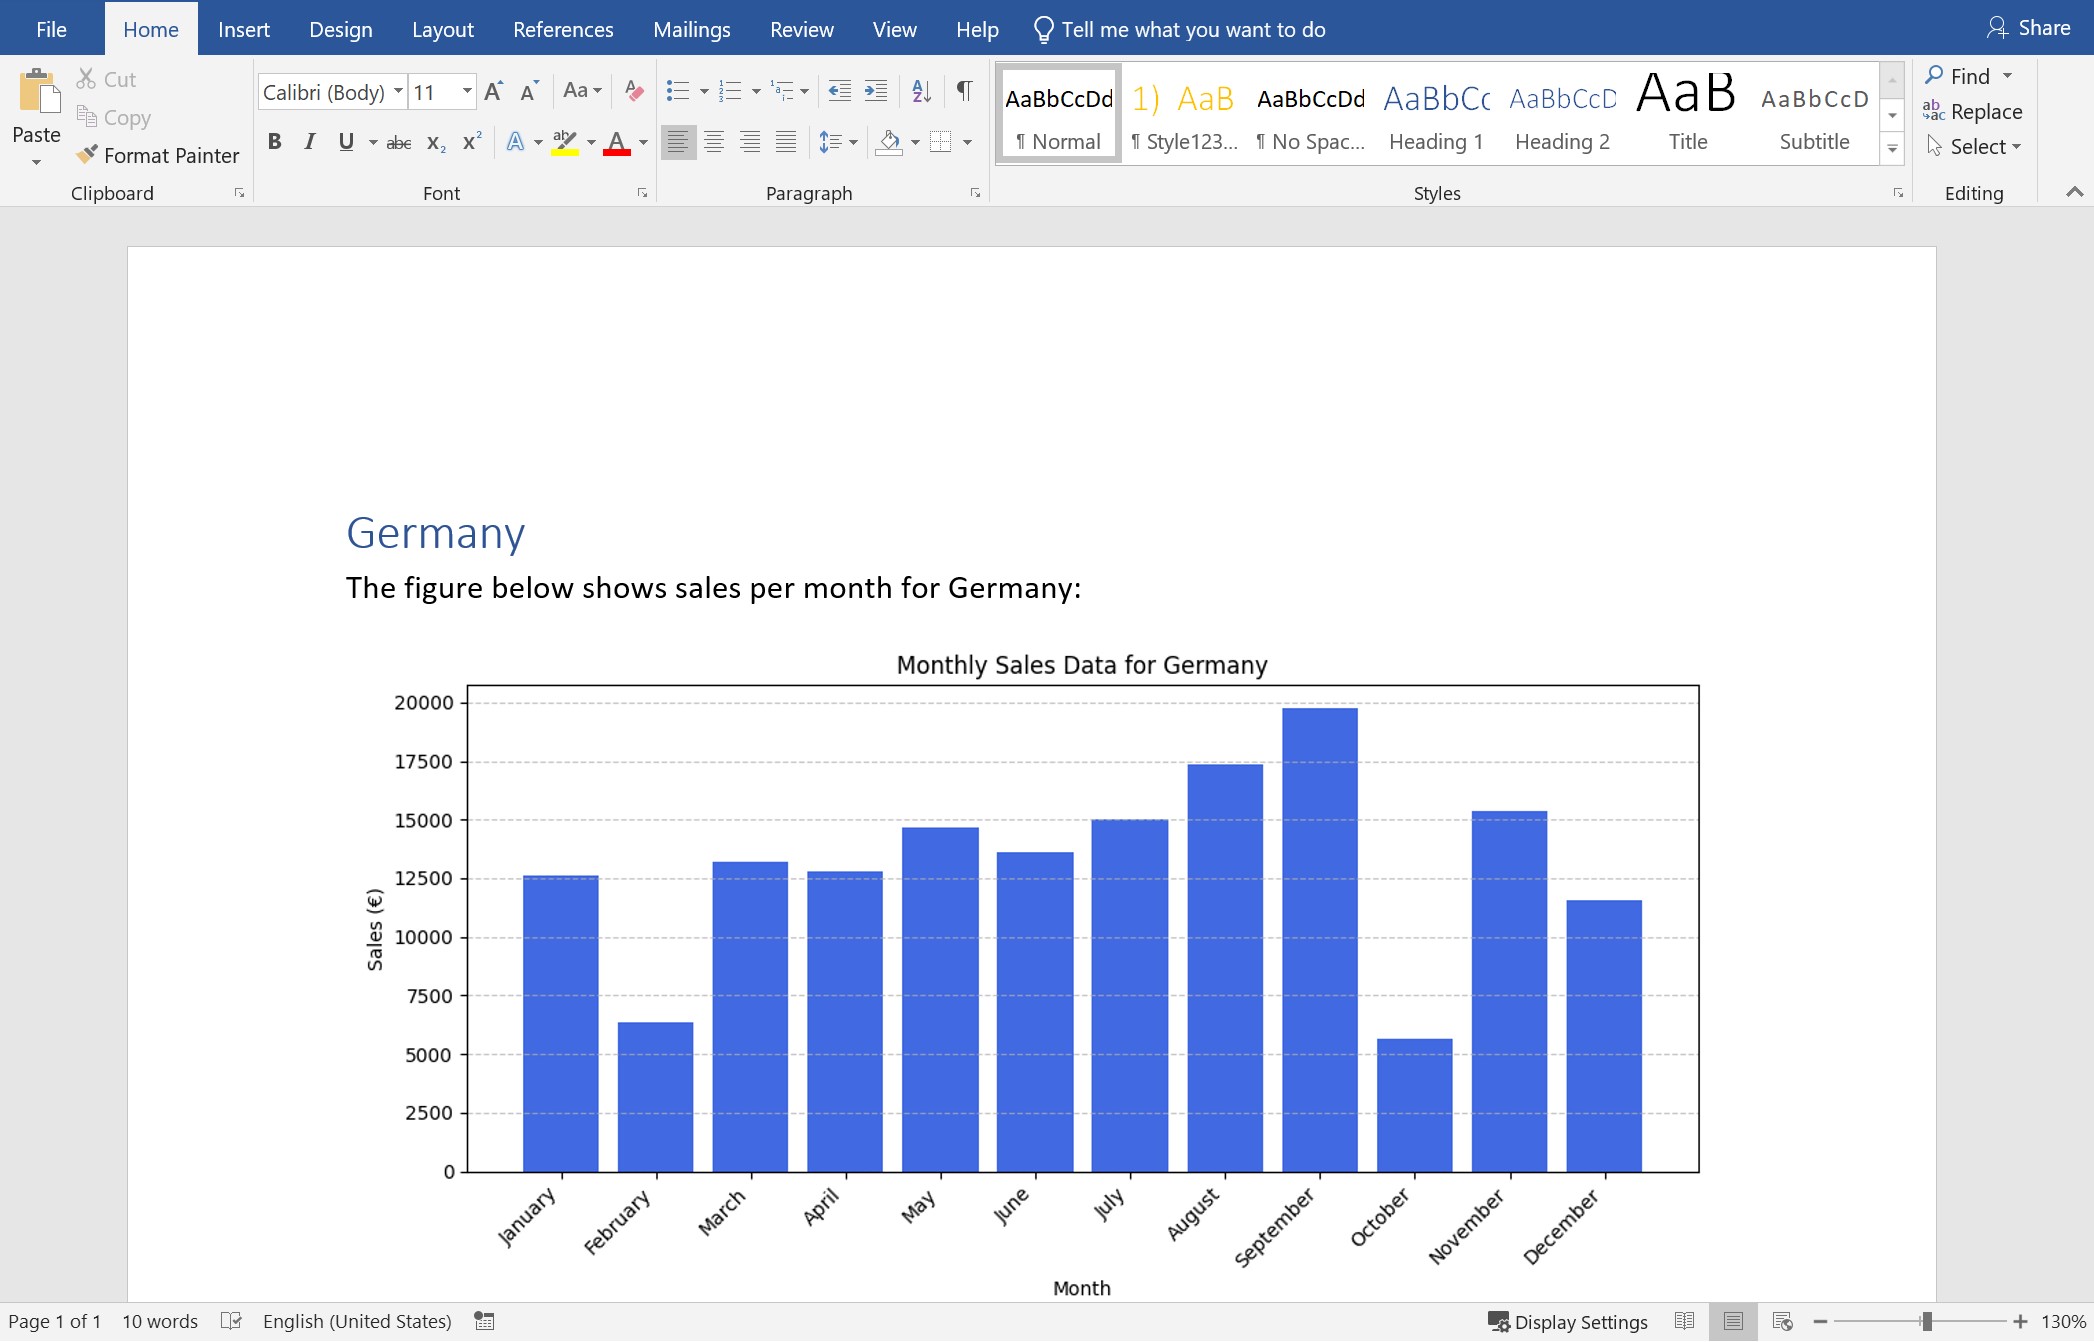
body: @iterator{country}
- text:
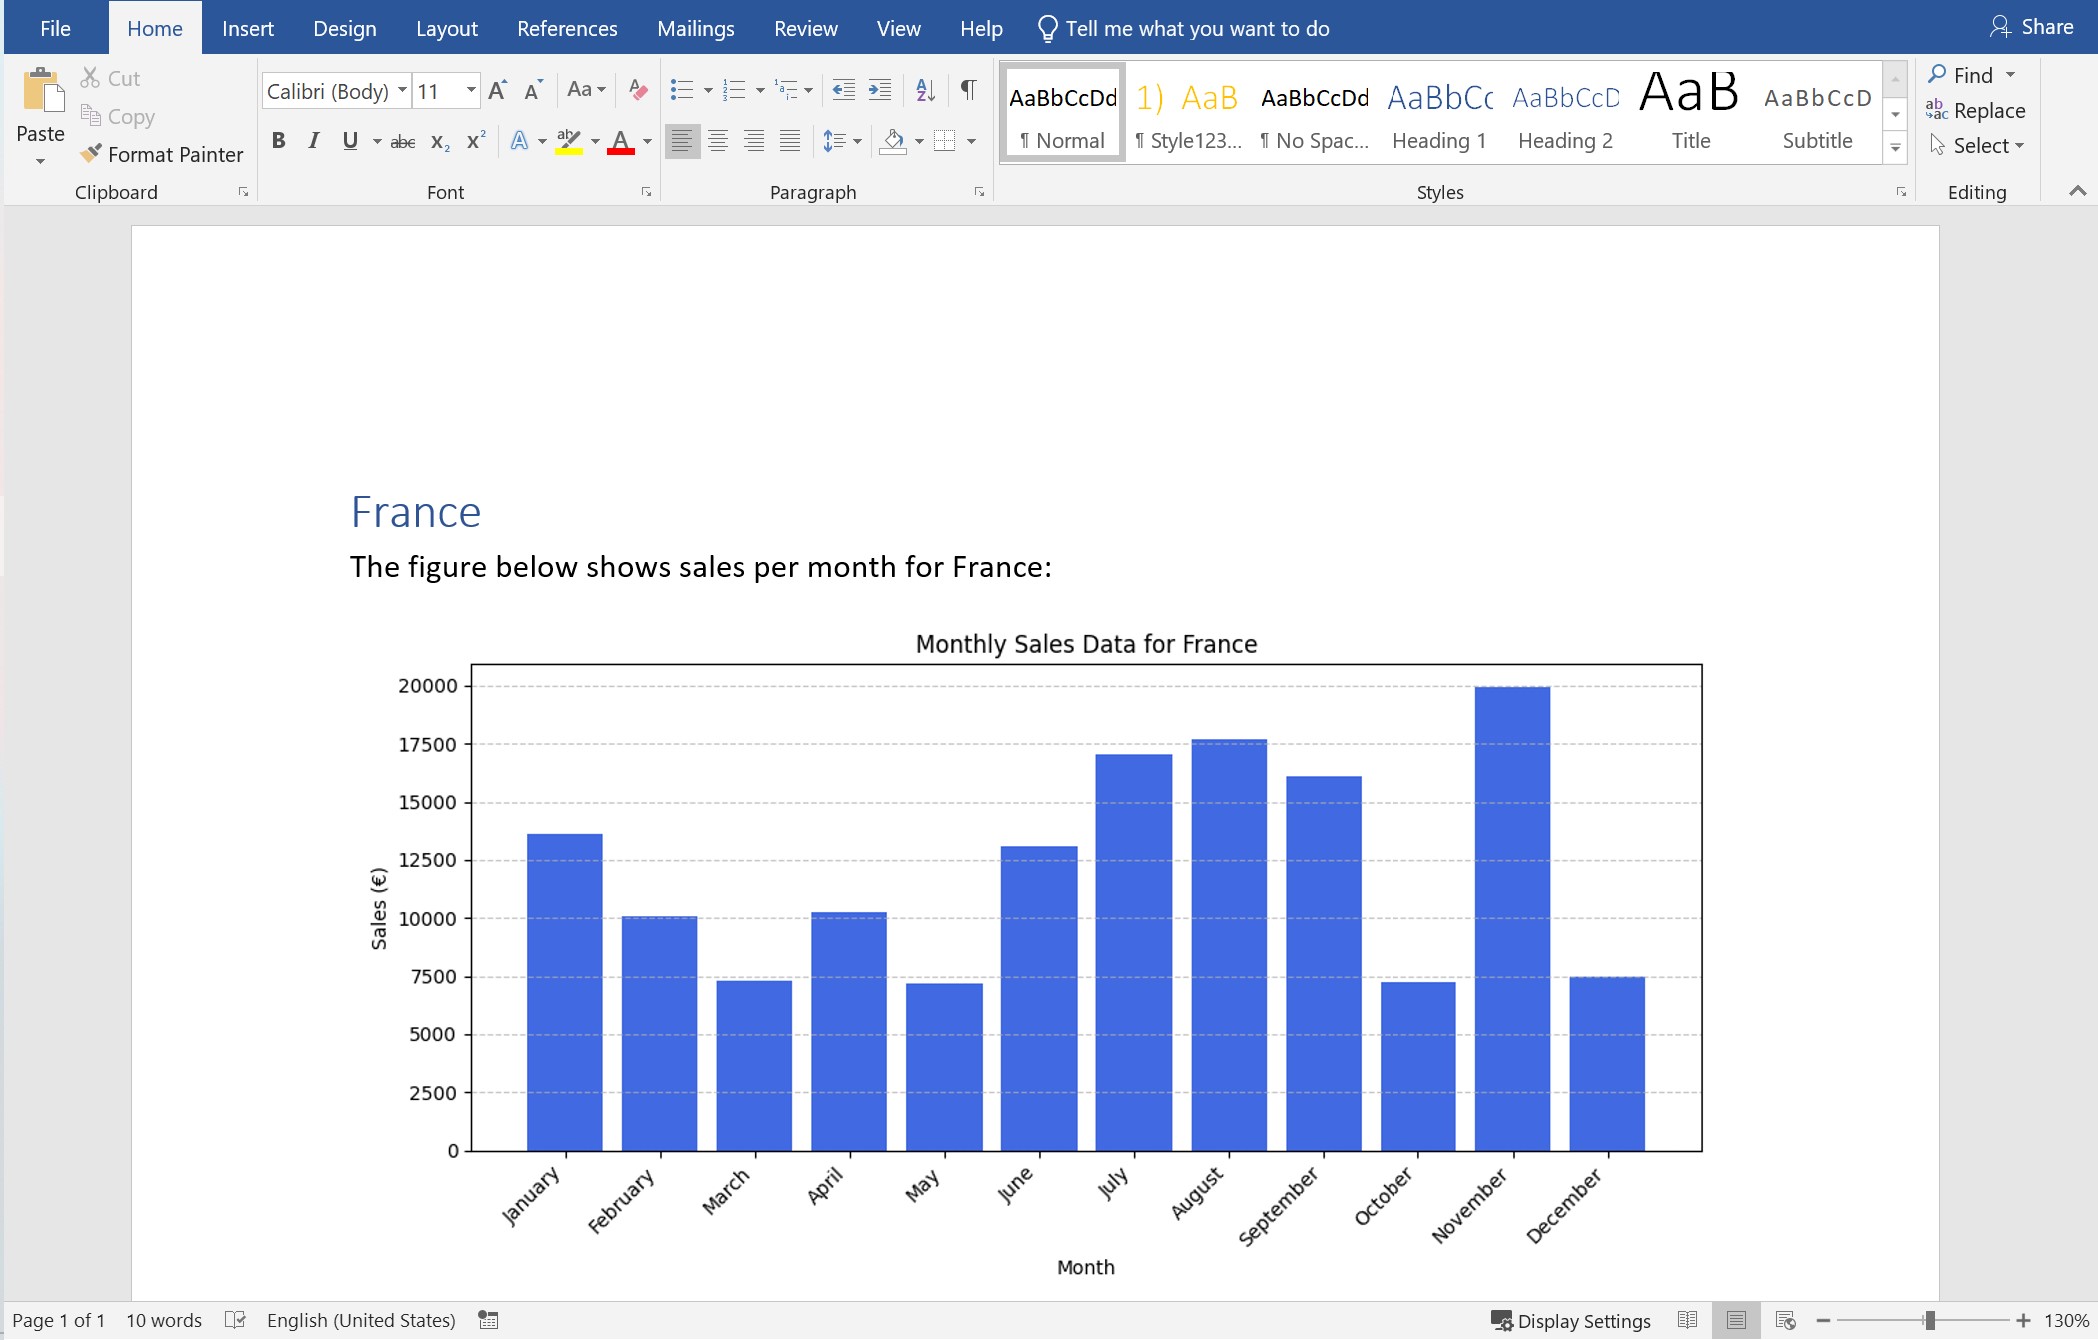
body: "The figure below shows sales per month for @iterator{country}:"
- figure:
source:
output: figure
source_type: python
python_executable: plot_sales_per_year
country_name: @iterator{country}
The example of output for France is:
The full document loop functionality is available at: Documents iteration.